Differential epiPot analysis: Perform enrichment
Source:vignettes/articles/differential_3_perform_enrichment.Rmd
differential_3_perform_enrichment.Rmd
library(conflicted)
library(epiPot)
library(tidyverse)
library(msigdbr)
library(clusterProfiler)
library(org.Hs.eg.db)

conflicts_prefer(
  base::intersect,
  base::union,
  dplyr::select,
  dplyr::filter,
  dplyr::rename
)
Load data
We use epiPot results created in part two of the analysis.
DATA_PATH <- tools::R_user_dir("epipot_articles", "cache")
load(paste0(DATA_PATH, "/epipot_results.rda"))
Helper functions
Click to show code
msigdb_hallmark <- msigdbr(species = "Homo sapiens", category = "H")
#> Warning: The `category` argument of `msigdbr()` is deprecated as of msigdbr 10.0.0.
#> ℹ Please use the `collection` argument instead.
#> This warning is displayed once per session.
#> Call `lifecycle::last_lifecycle_warnings()` to see where this warning was
#> generated.
msigdb_term2gene <-
  msigdb_hallmark %>%
  dplyr::select(gs_name, entrez_gene)


# Enrichment wrappers ----

enrichmsigdb_wrapper <- function(entrez_ids, bg_entrez) {
  res <- clusterProfiler::enricher(
    gene = entrez_ids,
    universe = bg_entrez,
    TERM2GENE = msigdb_term2gene,
    pAdjustMethod = "BH",
    pvalueCutoff = 1,
    qvalueCutoff = 1
  )
  if (!is.null(res) && nrow(res@result) > 0) {
    res <- clusterProfiler::setReadable(res, OrgDb = org.Hs.eg.db, keyType = "ENTREZID")
  }
  res
}

enrichGO_wrapper <- function(entrez_ids, bg_entrez) {
  clusterProfiler::enrichGO(
    gene = entrez_ids,
    universe = bg_entrez,
    OrgDb = org.Hs.eg.db,
    keyType = "ENTREZID",
    ont = "BP",
    pAdjustMethod = "BH",
    pvalueCutoff = 1,
    qvalueCutoff = 1,
    readable = TRUE
  )
}

enrichKEGG_wrapper <- function(entrez_ids, bg_entrez) {
  res <- clusterProfiler::enrichKEGG(
    gene = entrez_ids,
    universe = bg_entrez,
    organism = "hsa",
    pAdjustMethod = "BH",
    pvalueCutoff = 1,
    qvalueCutoff = 1
  )
  if (!is.null(res) && nrow(res@result) > 0) {
    res <- setReadable(res, OrgDb = org.Hs.eg.db, keyType = "ENTREZID")
  }
  res
}

enrichReactome_wrapper <- function(entrez_ids, bg_entrez) {
  ReactomePA::enrichPathway(
    gene = entrez_ids,
    universe = bg_entrez,
    organism = "human",
    pAdjustMethod = "BH",
    pvalueCutoff = 1,
    qvalueCutoff = 1,
    readable = TRUE
  )
}


# Enrichment runner ----

perform_enrichment <- function(
    genes_of_interest,
    background_genes,
    cell_type = NULL,
    condition = NULL,
    contrast = NULL,
    ...
) {
  # Validate input
  if (length(genes_of_interest) == 0) {
    message("No genes of interest provided")
    return(list(msigdb=NULL, ego=NULL, kegg=NULL, reactome=NULL))
  }

  # Convert gene IDs
  gene_ids <- tryCatch({
    bitr(
      genes_of_interest,
      fromType = "SYMBOL",
      toType = "ENTREZID",
      OrgDb = org.Hs.eg.db
    )
  }, error = function(e) {
    message("Gene ID conversion failed: ", e$message)
    return(NULL)
  })

  if (is.null(gene_ids)) return(
    list(
      msigdb=NULL,
      ego=NULL,
      kegg=NULL,
      reactome=NULL
    )
  )

  # Convert background IDs
  bg_ids <- tryCatch({
    bitr(
      background_genes,
      fromType = "SYMBOL",
      toType = "ENTREZID",
      OrgDb = org.Hs.eg.db
    )
  }, error = function(e) {
    message("Background gene conversion failed: ", e$message)
    return(NULL)
  })

  if (is.null(bg_ids)) return(
    list(
      msigdb=NULL,
      ego=NULL,
      kegg=NULL,
      reactome=NULL
    )
  )

  # Harmonize Entrez IDs
  entrez_before <- unique(na.omit(gene_ids$ENTREZID))
  bg_entrez     <- unique(na.omit(bg_ids$ENTREZID))

  # Restrict to background universe
  entrez_ids <- intersect(entrez_before, bg_entrez)

  # Report removed IDs
  if (length(entrez_ids) < length(entrez_before)) {
    message(sprintf("Removed %d Entrez IDs not present in background",
                    length(entrez_before) - length(entrez_ids)))
  }

  # Stop if no overlap
  if (length(entrez_ids) == 0) {
    message("No overlap between genes_of_interest and background after ID harmonization")
    return(list(msigdb=NULL, ego=NULL, kegg=NULL, reactome=NULL))
  }

  # Run enrichment
  list(
    msigdb = enrichmsigdb_wrapper(entrez_ids, bg_entrez),
    ego = enrichGO_wrapper(entrez_ids, bg_entrez),
    kegg = enrichKEGG_wrapper(entrez_ids, bg_entrez),
    reactome = enrichReactome_wrapper(entrez_ids, bg_entrez),
    metadata = list(
      cell_type = cell_type,
      condition = condition,
      contrast = contrast,
      ...
    )
  )
}


# Enrichment results processing ----

calculate_odds_ratio <- function(df) {
  df %>%
    mutate(
      # Query genes in term
      x = as.numeric(sub("/.*","", GeneRatio)),
      # Total query genes
      y = as.numeric(sub(".*/","", GeneRatio)),
      # Background genes in term
      a = as.numeric(sub("/.*","", BgRatio)),
      # Total background genes
      b = as.numeric(sub(".*/","", BgRatio)),
      # Fisher-style odds ratio
      OddsRatio = ((x + 0.5)/ (y - x + 0.5)) /
        ((a - x + 0.5) / (b - a - y + x + 0.5))
    )
}

process_enrichment_results <- function(results_list, metadata_fields = c("cell_type", "condition", "contrast", "wedge")) {
  purrr::map_dfr(names(results_list), function(name) {
    res <- results_list[[name]]
    if (is.null(res)) return(dplyr::tibble())

    # Extract metadata
    meta <- res$metadata
    res$metadata <- NULL

    # Parse analysis name
    name_parts <- strsplit(name, "\\|")[[1]]
    if (length(name_parts) >= 2) {
      meta$cell_type <- name_parts[1]
      meta$condition <- name_parts[2]
      if (length(name_parts) >= 3) meta$wedge <- name_parts[3]
    }

    purrr::map_dfr(c("msigdb", "ego", "kegg", "reactome"), function(enrich_type) {
      enrich_obj <- res[[enrich_type]]

      if (is.null(enrich_obj) || is.null(enrich_obj@result) || nrow(enrich_obj@result) == 0) {
        return(dplyr::tibble())
      }

      df <- enrich_obj@result %>%
        dplyr::filter(Count >= 1)

      if (nrow(df) == 0) return(dplyr::tibble())

      # Attach metadata
      for (field in metadata_fields) {
        if (field == "cell_type") {
          df[[field]] <- if (!is.null(meta$cell_type)) meta$cell_type else NA_character_
        } else if (field == "condition") {
          df[[field]] <- if (!is.null(meta$condition)) meta$condition else NA_character_
        } else if (field == "contrast") {
          df[[field]] <- if (!is.null(meta$contrast)) meta$contrast else NA_character_
        } else if (field == "wedge") {
          df[[field]] <- if (!is.null(meta$wedge)) meta$wedge else NA_character_
        } else {
          df[[field]] <- if (!is.null(meta[[field]])) meta[[field]] else NA_character_
        }
      }

      df <- df %>%
        dplyr::mutate(Source = dplyr::case_when(
          enrich_type == "ego" ~ "GO",
          enrich_type == "msigdb" ~ "MSIGDB",
          TRUE ~ toupper(enrich_type)
        )) %>%
        calculate_odds_ratio()

      if (!is.null(name)) df$Analysis <- name

      df
    })
  })
}


# Enrichment plotting ----

order_by_oddsratio <- function(df) {
  df %>%
    group_by(Description) %>%
    # Order by maximum odds ratio
    summarize(sorting_value = max(OddsRatio)) %>%
    arrange(desc(sorting_value)) %>%
    pull(Description) %>%
    as.character()
}

create_enrichment_plot <- function(
    df,
    facet_mode = c("none", "rows", "grid", "condition_wedge", "condition_source"),
    wedge_labels = NULL,
    condition_labels = NULL,
    or_cap = 20
) {
  if (nrow(df) == 0) return(NULL)

  facet_mode <- match.arg(facet_mode)

  # Cap odds ratio
  df <- df %>%
    mutate(OddsRatio = pmin(OddsRatio, or_cap))

  purple_scheme <- c("white", "#6a3d9a")

  term_order <- order_by_oddsratio(df)

  p <- ggplot(df, aes(
    x = factor(Description, levels = rev(term_order)),
    y = CellType,
    size = -log10(p.adjust),
    color = OddsRatio
  )) +
    geom_point() +
    scale_color_gradientn(colors = purple_scheme) +
    scale_y_discrete(labels = function(y) stringr::str_trunc(y, 50)) +
    scale_x_discrete(labels = function(x) stringr::str_trunc(x, 50)) +
    epiPot:::theme_epipot(
      base_size = 6,
      grid = FALSE,
      rotate = TRUE,
      base_family = "Helvetica"
    ) +
    theme(
      legend.position = "bottom",
      legend.key.size = unit(0.4, "cm"),
      legend.margin = margin(0, 0, 0, 0, unit = "pt"),
      legend.box.spacing = unit(2, "mm"),
      legend.title.position = "top"
    ) +
    labs(
      x = NULL,
      y = NULL,
      size = "-log10(p.adjust)",
      color = "Odds Ratio"
    )

  # Apply faceting
  if (facet_mode == "condition_wedge") {

    p <- p + facet_grid(
      Condition ~ Wedge,
      scales = "free",
      space = "free",
      labeller = labeller(
        Condition = condition_labels,
        Wedge = wedge_labels
      )
    )

  } else if (facet_mode == "condition_source") {

    p <- p + facet_grid(
      Condition ~ Source,
      scales = "free",
      space = "free",
      labeller = labeller(
        Condition = condition_labels
      )
    )

  } else if (facet_mode == "grid") {

    p <- p + facet_grid(
      Wedge ~ Source,
      scales = "free",
      space = "free",
      labeller = labeller(Wedge = wedge_labels)
    )

  } else if (facet_mode == "rows") {

    p <- p + facet_grid(
      . ~ Source,
      scales = "free",
      space = "free"
    )
  }

  return(p)
}


# Collapse GO terms ----

jaccard <- function(ll) {
  ids <- names(ll)

  mat <- matrix(
    0,
    nrow = length(ids),
    ncol = length(ids),
    dimnames = list(ids, ids)
  )

  for (i in ids) {
    for (j in ids) {
      mat[i, j] <- length(intersect(ll[[i]], ll[[j]])) /
        length(union(ll[[i]], ll[[j]]))
    }
  }

  diag(mat) <- 0
  mat
}

collapse_redundant_terms <- function(enr_df,
                                     jaccard_cutoff = 0.35) {

  enr_sig <- enr_df %>%
    dplyr::mutate(
      term_key = paste(Source, ID, sep = "::")
    )

  term_gene_sets <- enr_sig %>%
    dplyr::select(Source, term_key, geneID) %>%
    dplyr::distinct() %>%
    tidyr::separate_rows(geneID, sep = "/") %>%
    dplyr::group_by(Source, term_key) %>%
    dplyr::summarise(
      genes = list(unique(geneID)),
      .groups = "drop"
    )

  group_maps <- purrr::map_dfr(
    split(term_gene_sets, term_gene_sets$Source),
    function(df_source) {

      gene_sets <- df_source$genes
      names(gene_sets) <- df_source$term_key

      if (length(gene_sets) == 1) {
        return(tibble::tibble(
          term_key = names(gene_sets),
          redundancy_group = paste0(df_source$Source[1], "_G1")
        ))
      }

      jac <- jaccard(gene_sets)
      adj <- jac >= jaccard_cutoff
      diag(adj) <- FALSE

      g <- igraph::graph_from_adjacency_matrix(
        adj,
        mode = "undirected"
      )

      cl <- igraph::components(g)$membership

      tibble::tibble(
        term_key = names(cl),
        redundancy_group = paste0(df_source$Source[1], "_G", cl)
      )
    }
  )

  enr_grouped <- enr_sig %>%
    dplyr::left_join(
      group_maps,
      by = "term_key",
      relationship = "many-to-one"
    )

  canonical_terms <- enr_grouped %>%
    dplyr::mutate(
      term_penalty = dplyr::case_when(
        Source == "KEGG" & stringr::str_detect(
          Description,
          stringr::regex("cancer|carcinoma|leukemia|infection|disease", ignore_case = TRUE)
        ) ~ 1,
        TRUE ~ 0
      )
    ) %>%
    dplyr::group_by(Source, redundancy_group) %>%
    dplyr::arrange(
      term_penalty,
      dplyr::desc(OddsRatio),
      p.adjust,
      dplyr::desc(Count)
    ) %>%
    dplyr::slice_head(n = 1) %>%
    dplyr::ungroup() %>%
    dplyr::select(
      Source,
      redundancy_group,
      canonical_ID = ID,
      canonical_Description = Description
    )

  enr_grouped <- enr_grouped %>%
    dplyr::left_join(
      canonical_terms,
      by = c("Source", "redundancy_group")
    )

  representative_by_combo <- enr_grouped %>%
    dplyr::group_by(
      CellType,
      Condition,
      Wedge,
      Source,
      redundancy_group
    ) %>%
    dplyr::mutate(
      term_penalty = dplyr::case_when(
        Source == "KEGG" & stringr::str_detect(
          Description,
          stringr::regex("cancer|carcinoma|leukemia|infection|disease", ignore_case = TRUE)
        ) ~ 1,
        TRUE ~ 0
      )
    ) %>%
    dplyr::arrange(
      term_penalty,
      dplyr::desc(OddsRatio),
      p.adjust,
      dplyr::desc(Count)
    ) %>%
    dplyr::slice_head(n = 1) %>%
    dplyr::ungroup() %>%
    dplyr::mutate(
      Original_ID = ID,
      Original_Description = Description,
      ID = canonical_ID,
      Description = canonical_Description
    )

  list(
    collapsed = representative_by_combo,
    grouped = enr_grouped
  )
}
Driver enrichment
Perform enrichment.
wedge_results <- list()
wedge_categories <- unique(na.omit(scatter_df$driver))
cell_types <- unique(scatter_df$cell_type)
conditions <- unique(scatter_df$condition)

combinations <- expand.grid(
  CellType = cell_types,
  Condition = conditions,
  Wedge = wedge_categories,
  stringsAsFactors = FALSE
)

for (i in seq_len(nrow(combinations))) {
  ctx <- combinations$CellType[i]
  cond <- combinations$Condition[i]
  wedge <- combinations$Wedge[i]
  combo_name <- paste(ctx, cond, wedge, sep = "|")

  # Get genes for this combination
  genes <- scatter_df %>%
    filter(cell_type == ctx, condition == cond, driver == wedge) %>%
    pull(genes) %>%
    unique()

  # Perform enrichment
  wedge_results[[combo_name]] <- tryCatch({
    perform_enrichment(
      genes_of_interest = genes,
      background_genes = rownames(voom_results_z_scaled$E),
      analysis_type = "wedge",
      wedge_type = wedge,
      cell_type = ctx,
      condition = cond
    )
  }, error = function(e) {
    message("Error processing ", combo_name, ": ", e$message)
    NULL
  })

  # Progress update
  message(sprintf("Processed %d/%d: %s", i, nrow(combinations), combo_name))
}
#> 'select()' returned 1:1 mapping between keys and columns
#> Loading required namespace: limma
#> 'select()' returned 1:many mapping between keys and columns
#> Reading KEGG annotation online: "https://rest.kegg.jp/link/hsa/pathway"...
#> Reading KEGG annotation online: "https://rest.kegg.jp/list/pathway/hsa"...
#> Processed 1/28: Oligodendrocytes|AD|RNA created
#> 'select()' returned 1:1 mapping between keys and columns
#> 'select()' returned 1:many mapping between keys and columns
#> Processed 2/28: Microglia|AD|RNA created
#> 'select()' returned 1:1 mapping between keys and columns
#> 'select()' returned 1:many mapping between keys and columns
#> Processed 3/28: OPCs|AD|RNA created
#> 'select()' returned 1:1 mapping between keys and columns
#> 'select()' returned 1:many mapping between keys and columns
#> Processed 4/28: Inhibitory neurons|AD|RNA created
#> 'select()' returned 1:1 mapping between keys and columns
#> 'select()' returned 1:many mapping between keys and columns
#> Processed 5/28: Excitatory neurons|AD|RNA created
#> 'select()' returned 1:1 mapping between keys and columns
#> 'select()' returned 1:many mapping between keys and columns
#> Processed 6/28: Astrocytes|AD|RNA created
#> 'select()' returned 1:1 mapping between keys and columns
#> 'select()' returned 1:many mapping between keys and columns
#> Processed 7/28: Vascular cells|AD|RNA created
#> 'select()' returned 1:1 mapping between keys and columns
#> 'select()' returned 1:many mapping between keys and columns
#> Processed 8/28: Oligodendrocytes|AD|RNA realized
#> 'select()' returned 1:1 mapping between keys and columns
#> 'select()' returned 1:many mapping between keys and columns
#> Processed 9/28: Microglia|AD|RNA realized
#> 'select()' returned 1:1 mapping between keys and columns
#> 'select()' returned 1:many mapping between keys and columns
#> Processed 10/28: OPCs|AD|RNA realized
#> 'select()' returned 1:1 mapping between keys and columns
#> 'select()' returned 1:many mapping between keys and columns
#> Processed 11/28: Inhibitory neurons|AD|RNA realized
#> 'select()' returned 1:1 mapping between keys and columns
#> 'select()' returned 1:many mapping between keys and columns
#> Processed 12/28: Excitatory neurons|AD|RNA realized
#> 'select()' returned 1:1 mapping between keys and columns
#> 'select()' returned 1:many mapping between keys and columns
#> Processed 13/28: Astrocytes|AD|RNA realized
#> 'select()' returned 1:many mapping between keys and columns
#> 'select()' returned 1:many mapping between keys and columns
#> Processed 14/28: Vascular cells|AD|RNA realized
#> 'select()' returned 1:1 mapping between keys and columns
#> 'select()' returned 1:many mapping between keys and columns
#> --> No gene can be mapped....
#> --> Expected input gene ID: 369,2053,1717,1282,604,4189
#> --> return NULL...
#> --> No gene can be mapped....
#> --> Expected input gene ID: 10459,9643,7014,1111,10933,10856
#> --> return NULL...
#> --> No gene can be mapped....
#> --> Expected input gene ID: 124,83440,5315,5160,5226,414328
#> --> return NULL...
#> --> No gene can be mapped....
#> --> Expected input gene ID: 10125,1950,112714,14,10846,151
#> --> return NULL...
#> Processed 15/28: Oligodendrocytes|AD|ATAC created
#> 'select()' returned 1:1 mapping between keys and columns
#> 'select()' returned 1:many mapping between keys and columns
#> Processed 16/28: Microglia|AD|ATAC created
#> 'select()' returned 1:1 mapping between keys and columns
#> 'select()' returned 1:many mapping between keys and columns
#> Processed 17/28: OPCs|AD|ATAC created
#> 'select()' returned 1:1 mapping between keys and columns
#> 'select()' returned 1:many mapping between keys and columns
#> Processed 18/28: Inhibitory neurons|AD|ATAC created
#> 'select()' returned 1:1 mapping between keys and columns
#> 'select()' returned 1:many mapping between keys and columns
#> --> No gene can be mapped....
#> --> Expected input gene ID: 1717,33,284119,8436,2820,27069
#> --> return NULL...
#> Processed 19/28: Excitatory neurons|AD|ATAC created
#> 'select()' returned 1:1 mapping between keys and columns
#> 'select()' returned 1:many mapping between keys and columns
#> Warning in calculate_qvalue(ora_res$pvalue): qvalue::qvalue() failed, returning
#> NA for qvalue. Error: missing values and NaN's not allowed if 'na.rm' is FALSE
#> Processed 20/28: Astrocytes|AD|ATAC created
#> 'select()' returned 1:1 mapping between keys and columns
#> 'select()' returned 1:many mapping between keys and columns
#> Processed 21/28: Vascular cells|AD|ATAC created
#> No genes of interest provided
#> Processed 22/28: Oligodendrocytes|AD|ATAC realized
#> 'select()' returned 1:1 mapping between keys and columns
#> 'select()' returned 1:many mapping between keys and columns
#> --> No gene can be mapped....
#> --> Expected input gene ID: 1149,47,718,1351,128338,51
#> --> return NULL...
#> Warning in calculate_qvalue(ora_res$pvalue): qvalue::qvalue() failed, returning
#> NA for qvalue. Error: missing values and NaN's not allowed if 'na.rm' is FALSE
#> Warning in calculate_qvalue(ora_res$pvalue): qvalue::qvalue() failed, returning
#> NA for qvalue. Error: missing values and NaN's not allowed if 'na.rm' is FALSE
#> Warning in calculate_qvalue(ora_res$pvalue): qvalue::qvalue() failed, returning
#> NA for qvalue. Error: missing values and NaN's not allowed if 'na.rm' is FALSE
#> Processed 23/28: Microglia|AD|ATAC realized
#> 'select()' returned 1:1 mapping between keys and columns
#> 'select()' returned 1:many mapping between keys and columns
#> Processed 24/28: OPCs|AD|ATAC realized
#> 'select()' returned 1:1 mapping between keys and columns
#> 'select()' returned 1:many mapping between keys and columns
#> Processed 25/28: Inhibitory neurons|AD|ATAC realized
#> No genes of interest provided
#> Processed 26/28: Excitatory neurons|AD|ATAC realized
#> 'select()' returned 1:1 mapping between keys and columns
#> 'select()' returned 1:many mapping between keys and columns
#> --> No gene can be mapped....
#> --> Expected input gene ID: 348,112,718,284119,217,1349
#> --> return NULL...
#> Warning in calculate_qvalue(ora_res$pvalue): qvalue::qvalue() failed, returning
#> NA for qvalue. Error: missing values and NaN's not allowed if 'na.rm' is FALSE
#> --> No gene can be mapped....
#> --> Expected input gene ID: 55276,223,2539,10327,2271,3101
#> --> return NULL...
#> --> No gene can be mapped....
#> --> Expected input gene ID: 120425,113220,1445,10544,10938,1020
#> --> return NULL...
#> Processed 27/28: Astrocytes|AD|ATAC realized
#> 'select()' returned 1:1 mapping between keys and columns
#> 'select()' returned 1:many mapping between keys and columns
#> Processed 28/28: Vascular cells|AD|ATAC realized
Process results.
wedge_df <- process_enrichment_results(
  wedge_results,
  metadata_fields = c("wedge_type", "cell_type", "condition")
) %>%
  rename(
    Wedge = wedge_type,
    CellType = cell_type,
    Condition = condition
  )

# Filter top terms
wedge_filtered <-
  wedge_df %>%
  filter(Count >= 3) %>%
  filter(p.adjust < 0.05)

collapsed_res <- collapse_redundant_terms(
  wedge_filtered,
  jaccard_cutoff = 0.5
)

wedge_df_collapsed_after <- collapsed_res$collapsed

group_map <- collapsed_res$grouped %>%
  select(
    Source,
    term_key,
    redundancy_group,
    canonical_ID,
    canonical_Description
  ) %>%
  distinct()

top_wedge_terms <-
  wedge_df_collapsed_after %>%
  group_by(CellType, Condition, Wedge, Source) %>%
  arrange(desc(OddsRatio)) %>%
  slice_head(n = 5) %>%
  ungroup()

top_groups <-
  top_wedge_terms %>%
  select(Wedge, Source, redundancy_group) %>%
  distinct()

wedge_df_raw_grouped <-
  wedge_df %>%
  mutate(
    term_key = paste(Source, ID, sep = "::")
  ) %>%
  inner_join(
    group_map,
    by = c("Source", "term_key")
  )

# Keep collapsed values
collapsed_exact <-
  wedge_df_collapsed_after %>%
  mutate(
    value_source = "collapsed_exact",
    ID_raw = Original_ID,
    Description_raw = Original_Description,
    ID_plot = canonical_ID,
    Description_plot = canonical_Description,
    ID = ID_plot,
    Description = Description_plot
  )

# Build raw fallback
raw_fallback <-
  wedge_df_raw_grouped %>%
  semi_join(
    top_groups,
    by = c("Wedge", "Source", "redundancy_group")
  ) %>%
  mutate(
    term_penalty = case_when(
      Source == "KEGG" & str_detect(
        Description,
        regex(
          "cancer|carcinoma|leukemia|infection|disease",
          ignore_case = TRUE
        )
      ) ~ 1,
      TRUE ~ 0
    )
  ) %>%
  group_by(CellType, Condition, Wedge, Source, redundancy_group) %>%
  arrange(
    term_penalty,
    desc(OddsRatio),
    p.adjust,
    desc(Count)
  ) %>%
  slice_head(n = 1) %>%
  ungroup() %>%
  mutate(
    value_source = "raw_fallback",
    ID_raw = ID,
    Description_raw = Description,
    ID_plot = canonical_ID,
    Description_plot = canonical_Description,
    ID = ID_plot,
    Description = Description_plot
  )

# Prefer collapsed values;
# use fallback for missing combinations
wedge_final_df <-
  bind_rows(
    collapsed_exact %>%
      semi_join(
        top_groups,
        by = c("Wedge", "Source", "redundancy_group")
      ),
    raw_fallback %>%
      anti_join(
        collapsed_exact,
        by = c("CellType", "Condition", "Wedge", "Source", "redundancy_group")
      )
  )


# Split wedge classes
created_df <-
  wedge_final_df %>%
  filter(Wedge == "ATAC created")

realized_df <-
  wedge_final_df %>%
  filter(Wedge == "RNA realized", Source %in% c("GO", "MSIGDB"))
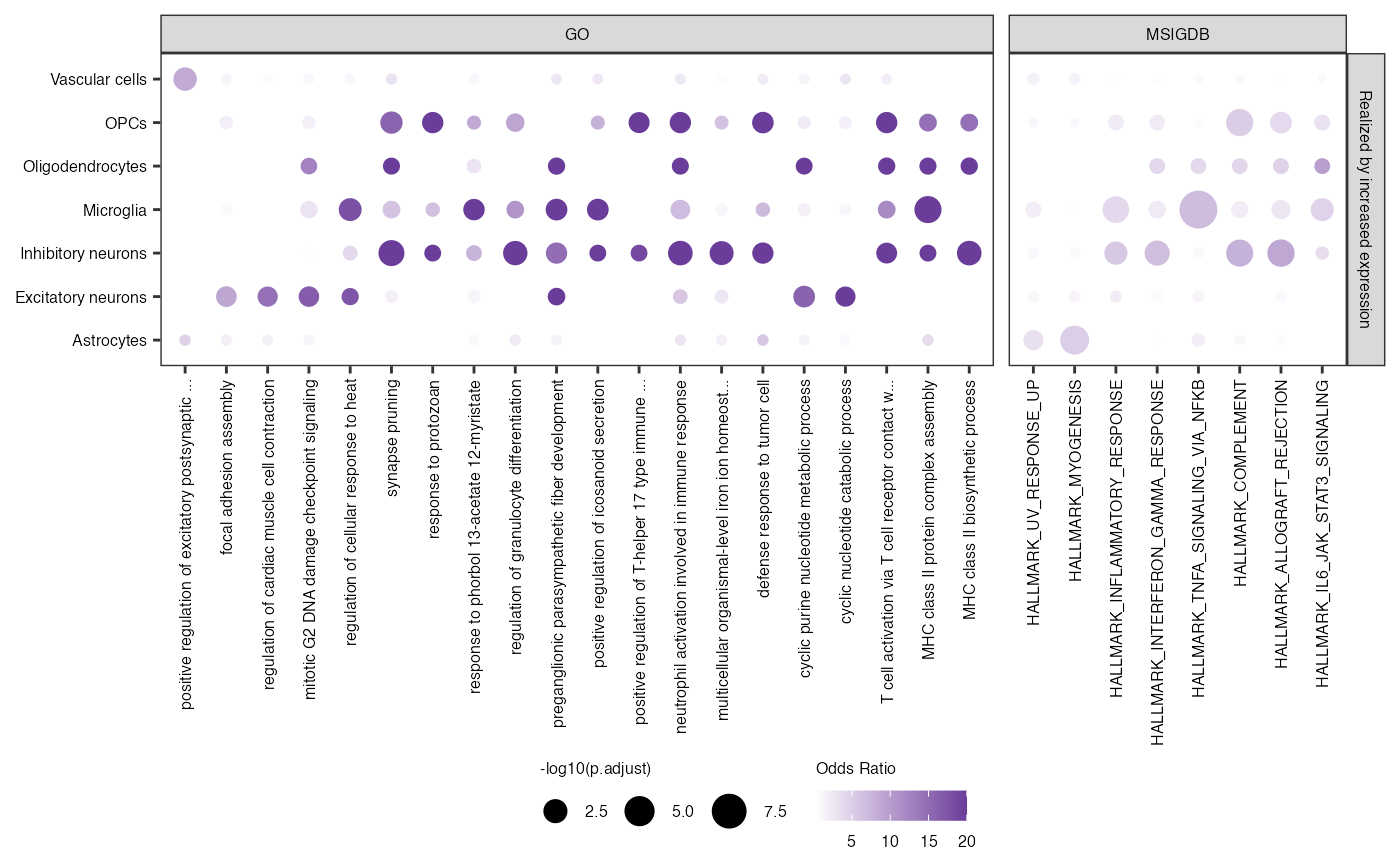
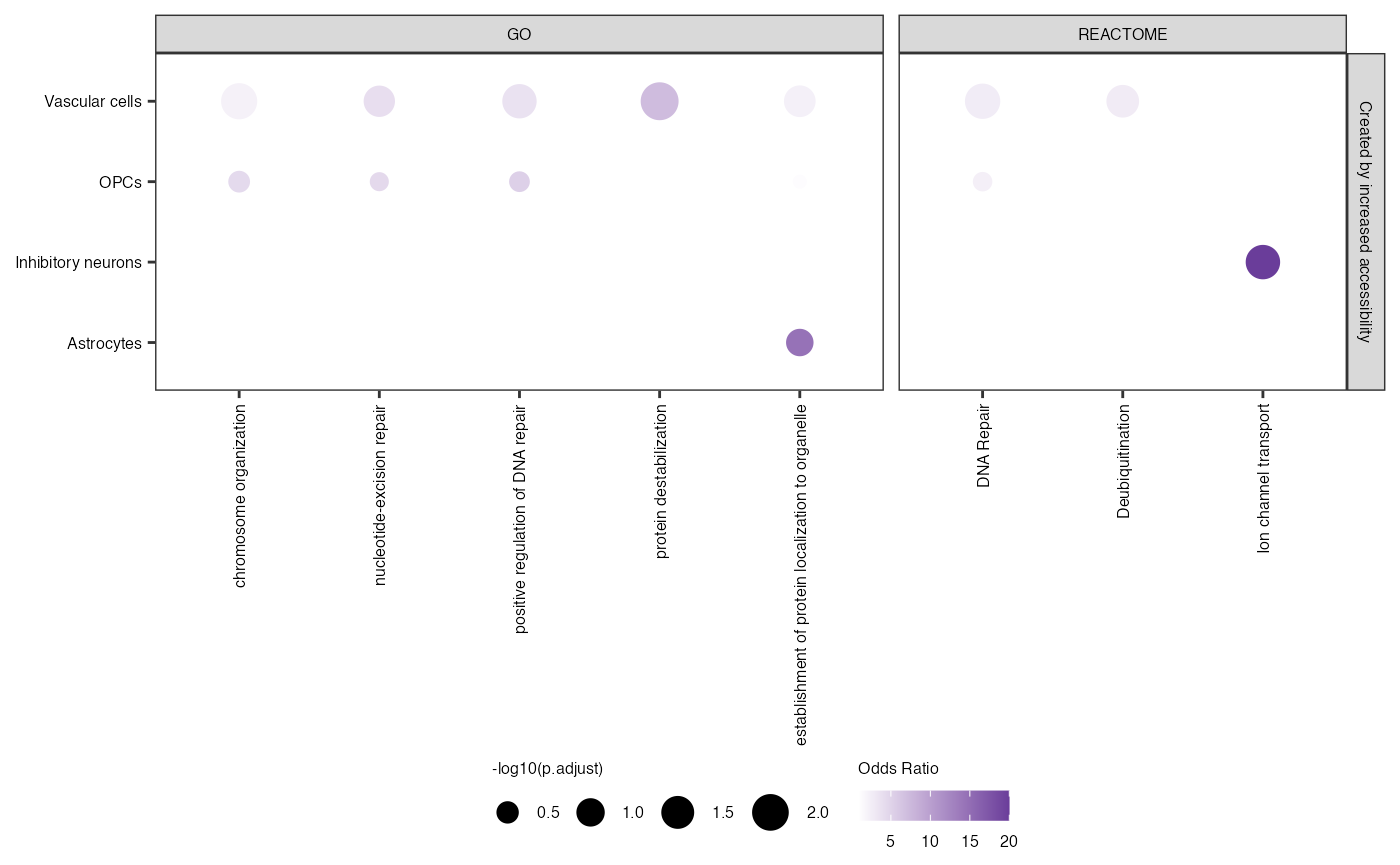
Generate plots.
PLOT_WEDGE_LABELS <- c(
  "RNA realized" = "Realized by increased expression",
  "RNA created" = "Created by increased expression",
  "ATAC realized" = "Realized by increased accessibility",
  "ATAC created" = "Created by increased accessibility",
  "created" = "Created by increased\nexpression",
  "realized" = "Realized by increased expression\nwithout DE genes"
)

create_enrichment_plot(
  created_df,
  facet_mode = "grid",
  wedge_labels = PLOT_WEDGE_LABELS
)
create_enrichment_plot(
  realized_df,
  facet_mode = "grid",
  wedge_labels = PLOT_WEDGE_LABELS
)